Mar-2025
Sales
Trend
6-Month
Product Count
SKUs
Overview
Market Insights Snapshot
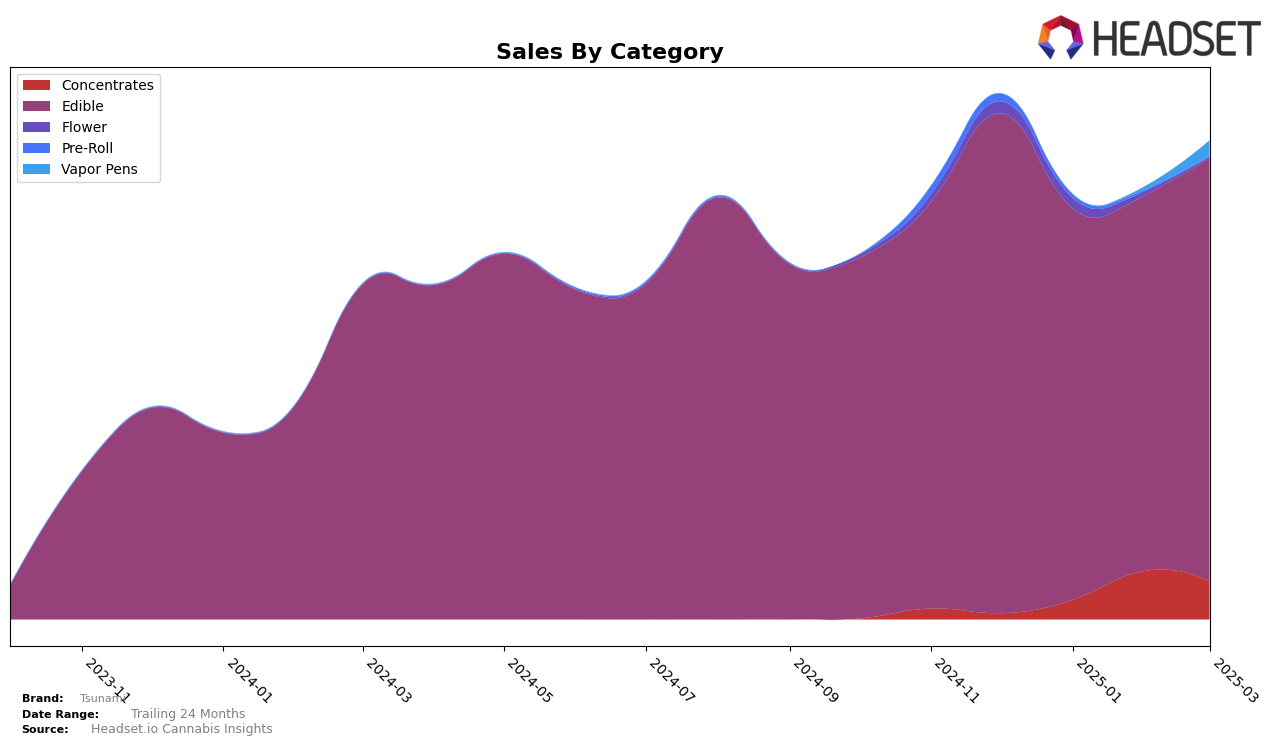
The performance of Tsunami across different categories and states reveals intriguing trends. In Missouri, Tsunami's presence in the Edible category showed a slight decline in the early months of 2025, as it moved from 7th place in December 2024 to 11th place by March 2025. Despite this, the brand maintained a consistent presence within the top 15, indicating a stable consumer base. Meanwhile, in the Vapor Pens category, Tsunami did not make it into the top 30 rankings, which might suggest a challenge in gaining traction or competition from other brands in this segment. This lack of ranking could be a signal for the brand to reassess its strategy in this category within the Missouri market.
In Nevada, Tsunami showed a promising upward trend in the Concentrates category, where it climbed from being unranked in December 2024 to reaching 13th place by February and March 2025. This positive movement highlights the brand's growing appeal in this category within the state. However, in the Flower category, Tsunami did not manage to break into the top 30 rankings in the early months of 2025, which might point to intense competition or a need for improved market penetration strategies. The contrast between the brand's performance in Concentrates versus Flower in Nevada presents an interesting dynamic worth exploring further.
Competitive Landscape
In the competitive landscape of the edible cannabis market in Missouri, Tsunami has experienced fluctuations in its ranking over the past few months. Starting from a strong position at 7th place in December 2024, Tsunami saw a decline to 11th place by January 2025, maintaining this rank through March 2025. This shift can be attributed to the performance of competitors such as Ostara Cannabis, which consistently held higher ranks, peaking at 9th place in March 2025. Meanwhile, DOSD Edibles showed a positive trend, improving its rank from 13th in December 2024 to 10th in March 2025, potentially impacting Tsunami's market position. Despite these challenges, Tsunami's sales figures indicate a recovery in March 2025, suggesting a potential rebound in the coming months. As the market dynamics continue to evolve, Tsunami's ability to adapt and innovate will be crucial in regaining its competitive edge.

Notable Products
In March 2025, GMO Guava Live Resin Badder (0.5g) emerged as the top-performing product for Tsunami, climbing from a rank of 4 in February to 1, with notable sales reaching 1454 units. Orange Crush Fruit Gummies 10-Pack (300mg), previously maintaining the top spot from December 2024 through February 2025, fell to the second position despite consistent sales performance. Sour Wild Berry Wipeout Gummies 10-Pack (2000mg) improved its rank to 3 from being unranked in February, indicating a resurgence in popularity. Sour Black Cherry Banzai Gummies 10-Pack (2000mg) saw a slight drop from the second position in February to fourth in March. Raspberry Riptide Gummies 10-Pack (600mg) maintained a steady fifth place from January through March, showcasing consistent demand.
Top Selling Cannabis Brands
Data for this report comes from real-time sales reporting by participating cannabis retailers via their point-of-sale systems, which are linked up with Headset’s business intelligence software. Headset’s data is very reliable, as it comes digitally direct from our partner retailers. However, the potential does exist for misreporting in the instance of duplicates, incorrectly classified products, inaccurate entry of products into point-of-sale systems, or even simple human error at the point of purchase. Thus, there is a slight margin of error to consider. Brands listed on this page are ranked in the top twenty within the market and product category by total retail sales volume.

