Mar-2025
Sales
Trend
6-Month
Product Count
SKUs
Overview
Market Insights Snapshot
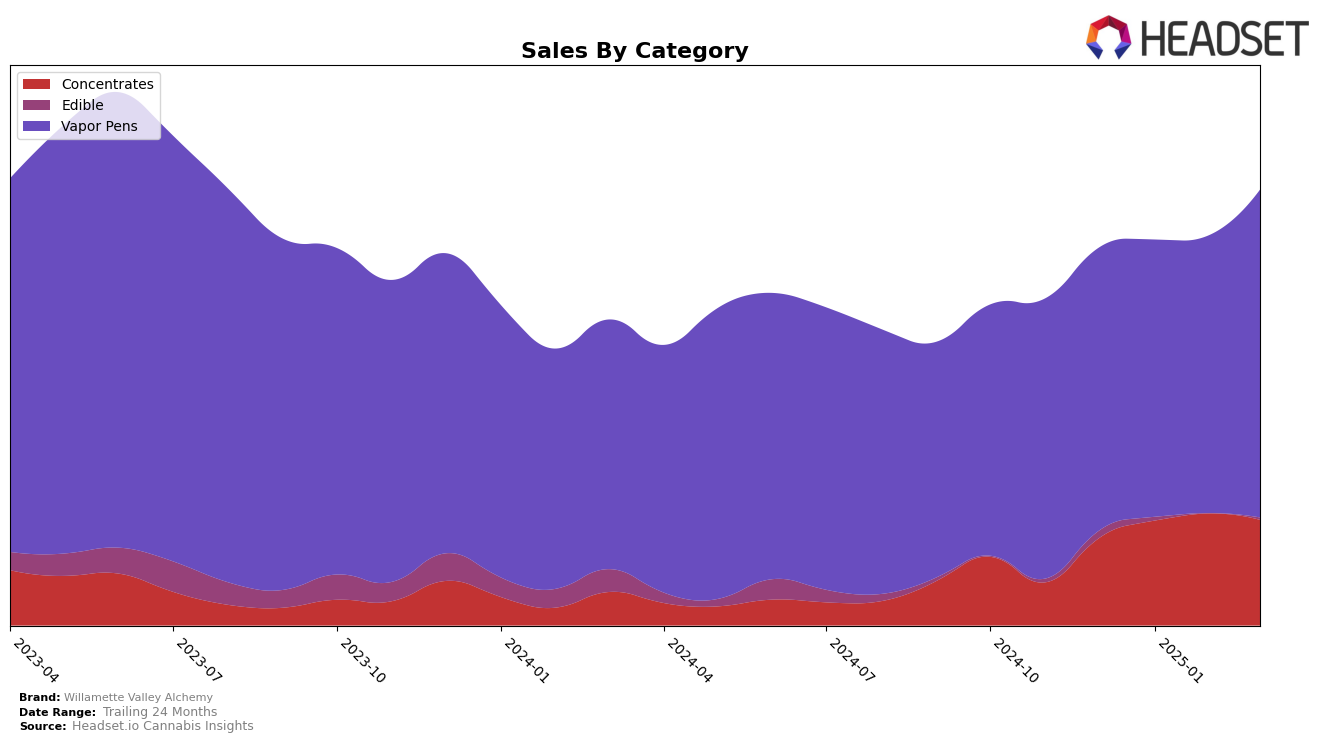
Willamette Valley Alchemy has shown a consistent performance in the Oregon market, particularly within the Concentrates category. Over the months from December 2024 to March 2025, the brand has improved its ranking from 26th to 21st, demonstrating a positive trajectory. This upward movement in the rankings corresponds with a steady increase in sales, peaking in February 2025. Such a trend reflects a growing consumer preference for their concentrates, a promising sign for the brand's future in this category. However, in the Edible category, the brand did not make it into the top 30 in February 2025, indicating a potential area for improvement or a shift in consumer preferences that may require strategic adjustments.
In the Vapor Pens category, Willamette Valley Alchemy maintained a stable ranking around the 26th position, with a slight improvement to 25th in March 2025. Despite the relatively stable rank, there was a noticeable increase in sales in March 2025, suggesting a potential growth in market share or consumer interest that could lead to better rankings in the future. This performance in the Vapor Pens category highlights the brand's ability to maintain consumer interest and possibly capitalize on market trends. Overall, while the brand has areas that could benefit from strategic focus, its performance in Oregon suggests a strong foundation in key product categories.
Competitive Landscape
In the competitive landscape of Oregon's vapor pen market, Willamette Valley Alchemy has shown a slight upward trend in rankings, moving from 26th place in December 2024 to 25th place by March 2025. This improvement is noteworthy, especially when compared to competitors like PRUF Cultivar / PRŪF Cultivar, which also saw a slight rise from 25th to 24th in the same period, and Kaprikorn, which made a more significant leap from 31st to 26th. Despite these gains, Willamette Valley Alchemy faces stiff competition from Sauce Essentials, consistently ranking higher, albeit with fluctuating sales. Meanwhile, Punch Bowl experienced a decline, dropping from 23rd to 27th, which could indicate an opportunity for Willamette Valley Alchemy to capture more market share. Overall, while Willamette Valley Alchemy's sales have shown a positive trajectory, the brand must continue to innovate and differentiate itself to climb higher in the rankings amidst a competitive field.

Notable Products
In March 2025, the top-performing product from Willamette Valley Alchemy was the Sativa Retreats Gummies 2-Pack (100mg) in the Edible category, reclaiming its top spot after a slight dip to third place in February. The GMO Wizard Cured Badder (2g) in the Concentrates category rose to second place, showing a strong increase from its fifth place in February. The Jelly Sorbet Liquid Live Resin Cartridge (1g) in the Vapor Pens category maintained consistent performance, securing the third position. The Blueberry Pancakes Liquid Live Resin Cartridge (1g) dropped to fourth place from its previous top ranking in February, with sales reaching 520 units. Notably, the LemonHeadz Liquid Cured Resin Cartridge (1g) entered the rankings in March at fifth place, indicating a new entry in the competitive landscape.
Top Selling Cannabis Brands
Data for this report comes from real-time sales reporting by participating cannabis retailers via their point-of-sale systems, which are linked up with Headset’s business intelligence software. Headset’s data is very reliable, as it comes digitally direct from our partner retailers. However, the potential does exist for misreporting in the instance of duplicates, incorrectly classified products, inaccurate entry of products into point-of-sale systems, or even simple human error at the point of purchase. Thus, there is a slight margin of error to consider. Brands listed on this page are ranked in the top twenty within the market and product category by total retail sales volume.

