Jun-2026
Sales
Trend
6-Month
Product Count
SKUs
Avg Price
YoY Sales Change
YoY Price Change
Market Insights Snapshot
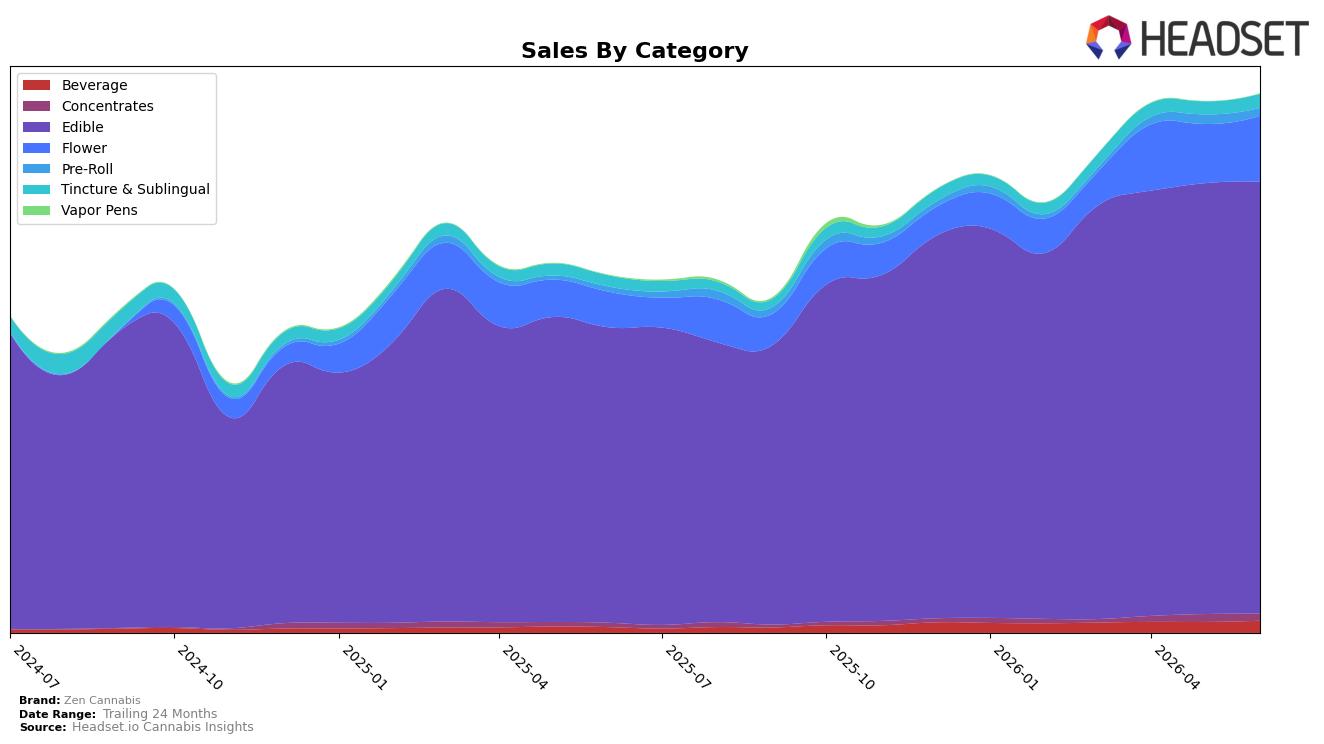
Zen Cannabis concentrated 80.40% of June 2026 sales in Edible, up 46.23% year over year and 0.26% month over month, while Flower reached 12.19% share with 86.04% YoY and 11.25% MoM growth; meanwhile, Beverage at 2.19% share surged 117.60% YoY and 11.24% MoM, and Tincture & Sublingual at 2.56% advanced 27.62% YoY and 8.64% MoM. Pre-Roll slipped 17.80% MoM to 1.40% share despite 59.45% YoY growth, and Concentrates fell 10.86% MoM to 1.24% share alongside 68.85% YoY growth; Vapor Pens contracted to 0.02% share with a -62.33% YoY change and no MoM reading. The mix indicates a primarily Edible-led model with accelerating second-line growth from Flower and Beverage, implying dependence on one core category for volume with selective expansion bets in faster-growing, smaller niches.
With an Edible category rank of 7 in Missouri and a brand-level sales increase of 51.04% YoY alongside a 3.13% YoY decline in average price, the brand is trading share gains for price leverage in its lead category while cultivating momentum in Flower (+11.25% MoM) and Beverage (+11.24% MoM). The negative MoM in Pre-Roll (-17.80%) and Concentrates (-10.86%) alongside Vapor Pens’ -62.33% YoY suggests pruning or deprioritization of lower-mix, lower-price or lower-velocity formats, reinforcing a positioning centered on Edible dominance with targeted adjacency growth in higher-growth subsegments rather than a broad portfolio push. The thesis is that maintaining a top-10 Edible position while seeding Flower and Beverage as hedge categories can sustain double-digit growth without diluting the core, provided pricing discipline continues to offset category-level promotions.
Competitive Landscape
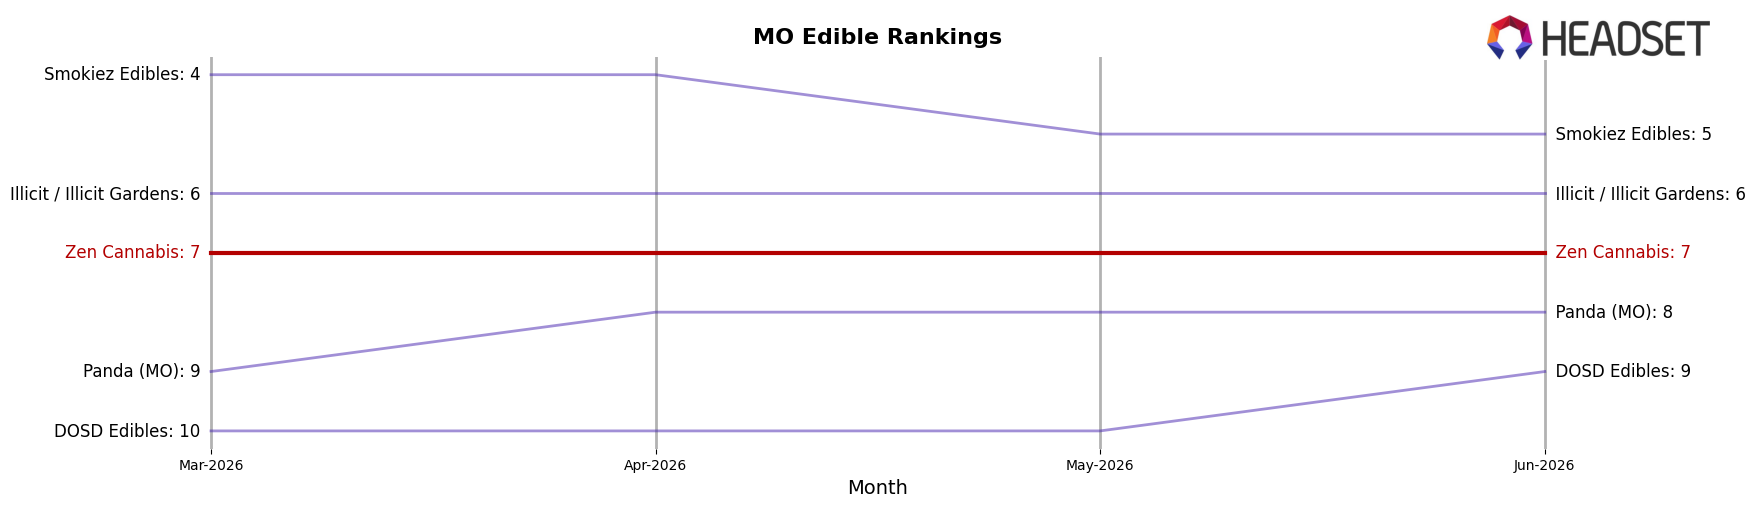
Zen Cannabis ranks #7 in MO Edible in June 2026, a 2-position climb from #9 year over year, while holding flat versus March 2026 at #7; in contrast, Gron / Grön stayed #1 year over year despite a 13.1% sales decline and Good Day Farm moved up from #4 to #2 on 19.4% YoY growth. Additional pressure comes from Good Taste, which advanced from #8 to #4 with a 65.3% YoY sales increase, while Smokiez Edibles slipped from #2 to #5 with a 23.4% YoY sales contraction; Zen Cannabis also set a peak rank of #7 in June 2026, indicating stabilization near the lower end of the top 10 rather than momentum toward the top 5.
Notable Products
Hybrid Watermelon Gummies 10-Pack (100mg) posted the steepest movement in June 2026 with a -18.4% month-over-month drop while sitting at rank 8, and CBD/THC 4:1 Grape NiteNite Gummies 10-Pack (400mg CBD, 100mg THC, 50mg Melatonin) also declined -9.6% at rank 1, indicating top-line reliance on SKUs that softened simultaneously. Countering that, Hybrid Mini Assorted Flavor Super High Dose Gummies 25-Pack (1000mg) climbed +13.0% at rank 9 as Sativa Mini Fruit Punch Gummies 25-Pack (250mg) rose +8.6% at rank 3, and five of the top ten are Mini 25-Pack or high-dose formats, pointing to a pivot toward potency and value sizing. The 20-Pack CBD/THC 4:1 Grape NiteNite edged +2.0% at rank 4 while Indica Mini Fruit Punch Gummies 25-Pack (250mg) slid -9.2% at rank 5, and the rank spread between positions 1 and 9 carrying both declines and double-digit gains implies a barbell demand profile concentrated in sleep and high-dose Minis. The pattern implies Zen Cannabis is migrating share from standard 10-packs toward Minis and higher-dosage offerings, using a sleep-led anchor at the top while cultivating high-potency formats to capture volume even as some classic 10-packs contract.
Top Selling Cannabis Brands
Data for this report comes from real-time sales reporting by participating cannabis retailers via their point-of-sale systems, which are linked up with Headset’s business intelligence software. Headset’s data is very reliable, as it comes digitally direct from our partner retailers. However, the potential does exist for misreporting in the instance of duplicates, incorrectly classified products, inaccurate entry of products into point-of-sale systems, or even simple human error at the point of purchase. Thus, there is a slight margin of error to consider. Brands listed on this page are ranked in the top twenty within the market and product category by total retail sales volume.

