Mar-2026
Sales
Trend
6-Month
Product Count
SKUs
Overview
Market Insights Snapshot
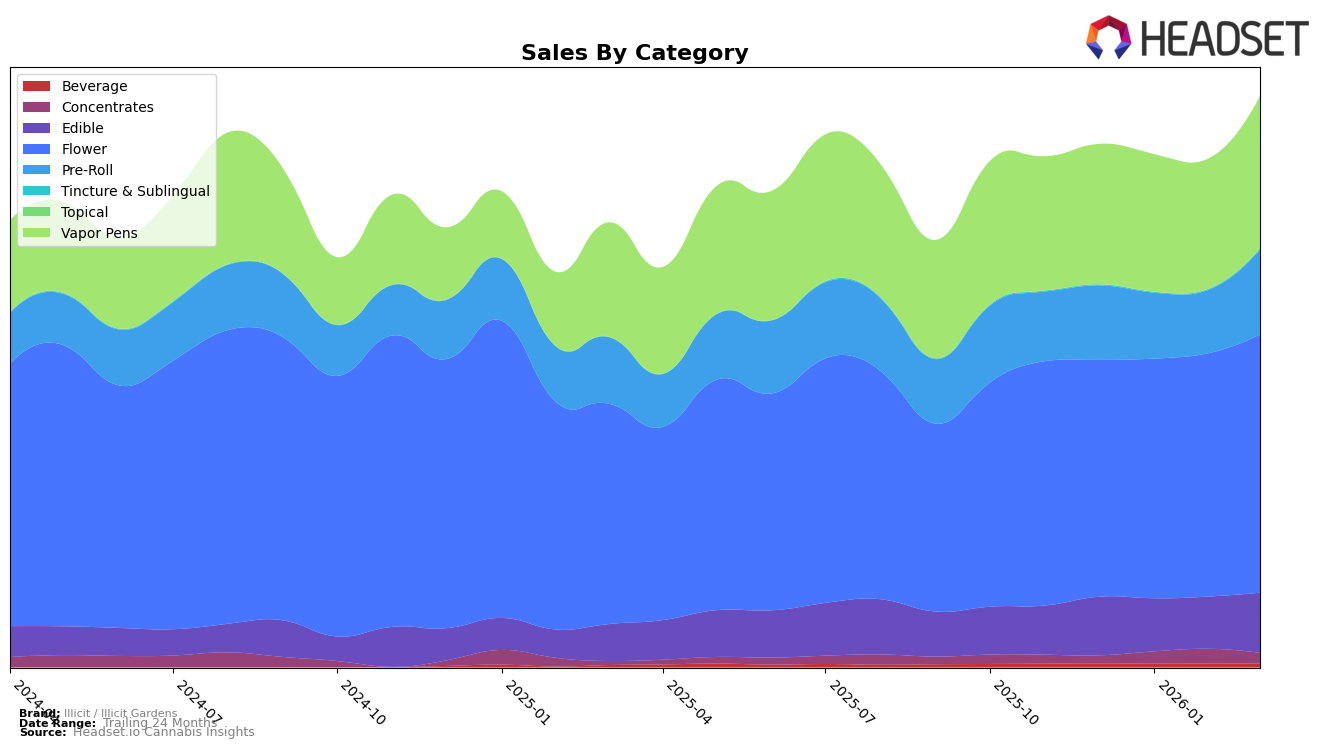
In Missouri, Illicit / Illicit Gardens has shown consistent performance across multiple product categories. Notably, their Flower category maintained a steady rank of 3rd place from December 2025 through March 2026, indicating a strong foothold in this segment. Their Edible products saw a slight dip in January and February but rebounded to 5th place by March, suggesting a recovery in consumer demand. Meanwhile, the Pre-Roll category showed a brief improvement in February, climbing to 2nd place, before settling back to 3rd in March. The Vapor Pens category remained stable, consistently holding the 2nd position, which underscores the brand's solid reputation in this product line.
In New Jersey, Illicit / Illicit Gardens has been making strides, particularly in the Flower category, where the brand improved its ranking from 27th in December 2025 to 17th in February 2026 before slightly declining to 21st in March. This indicates a growing presence and potential for further market penetration. However, in the Vapor Pens category, the brand only entered the top 30 in February 2026, securing the 20th position, before slipping to 23rd in March. This suggests that while the brand is gaining traction, there is still room for improvement to solidify its standing in the New Jersey market.
Competitive Landscape
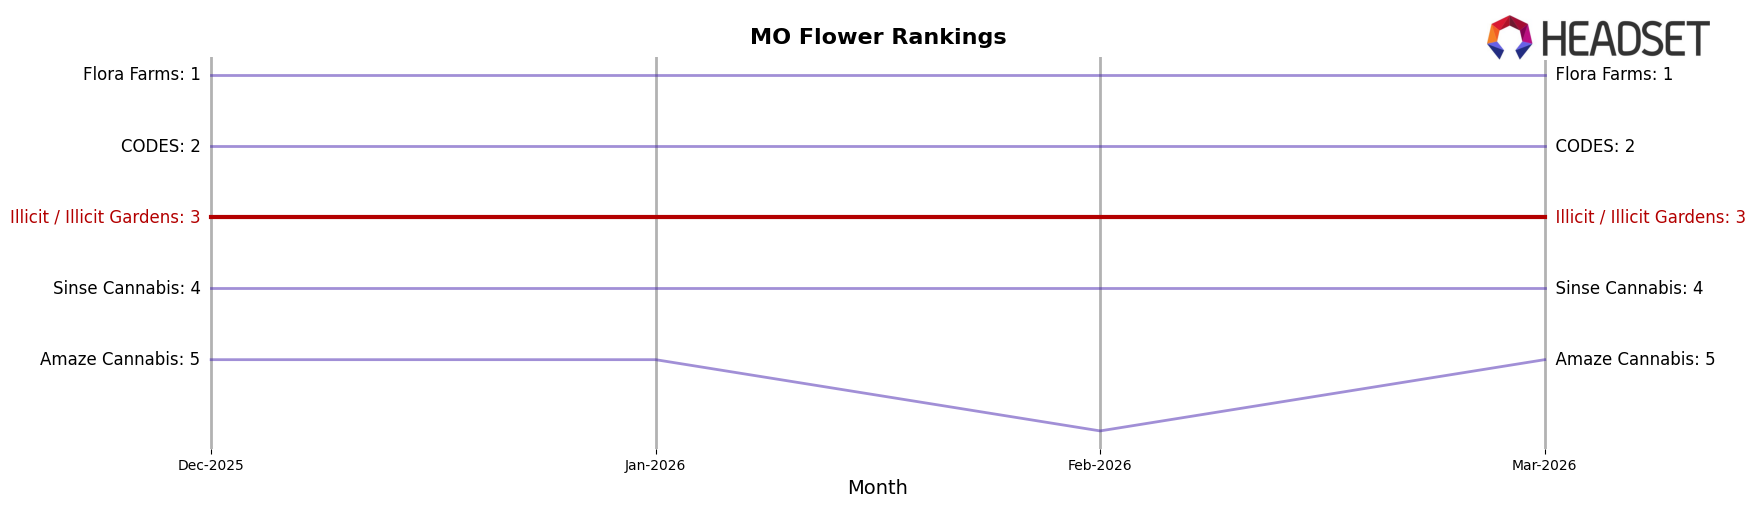
In the Missouri flower category, Illicit / Illicit Gardens consistently maintained its position as the third-ranked brand from December 2025 through March 2026, showcasing a steady performance amidst a competitive landscape. Despite facing strong competition from top-ranked brands like Flora Farms and CODES, Illicit / Illicit Gardens demonstrated resilience by sustaining its rank and even increasing its sales from $3,791,344 in December 2025 to $4,036,096 in March 2026. This upward sales trend indicates a growing consumer preference or effective marketing strategies. Meanwhile, Sinse Cannabis and Amaze Cannabis maintained their fourth and fifth positions, respectively, with Amaze Cannabis experiencing fluctuations in sales, suggesting potential vulnerabilities that Illicit / Illicit Gardens could capitalize on to further solidify its market position.
Notable Products
In March 2026, Ghost OG (3.5g) maintained its position as the top-selling product for Illicit / Illicit Gardens, with impressive sales reaching 11,857 units. Gorilla Pie (3.5g) also held steady at the second rank, continuing its consistent performance from previous months. GMO Cookies (3.5g) showed a positive shift, climbing from fourth to third place in the rankings. The CBD/CBN/THC 2:2:1 Peaches & Dreams Nighttime Gummies 10-Pack remained a popular choice, holding the fourth position, reflecting stable consumer demand. Dr. Funkenstein (3.5g) re-entered the rankings at fifth place, indicating renewed interest in this product.
Top Selling Cannabis Brands
Data for this report comes from real-time sales reporting by participating cannabis retailers via their point-of-sale systems, which are linked up with Headset’s business intelligence software. Headset’s data is very reliable, as it comes digitally direct from our partner retailers. However, the potential does exist for misreporting in the instance of duplicates, incorrectly classified products, inaccurate entry of products into point-of-sale systems, or even simple human error at the point of purchase. Thus, there is a slight margin of error to consider. Brands listed on this page are ranked in the top twenty within the market and product category by total retail sales volume.

