Mar-2025
Sales
Trend
6-Month
Product Count
SKUs
Overview
Market Insights Snapshot
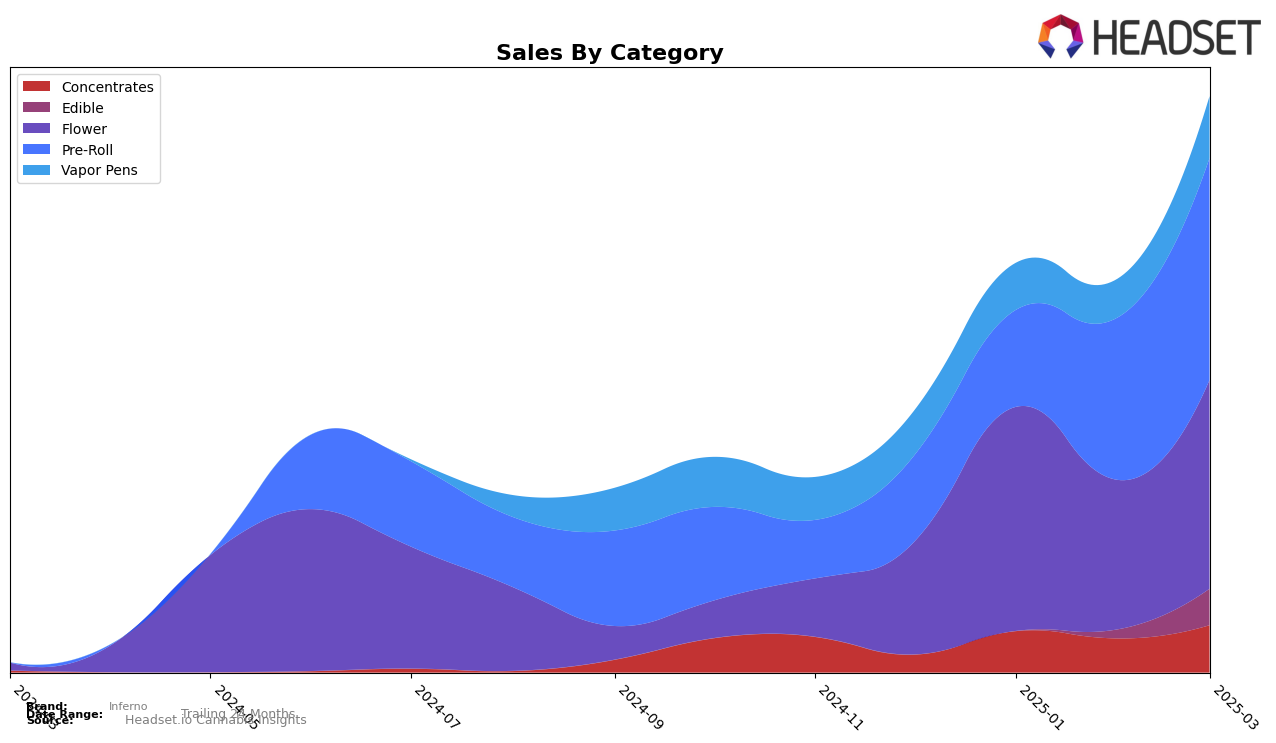
In Massachusetts, Inferno has shown notable progress in the Concentrates category, where it climbed from a ranking of 54 in December 2024 to 28 by March 2025. This upward trend is indicative of the brand's growing popularity and acceptance among consumers in the state. The sales figures reflect this positive trajectory, with a significant increase observed over the months. However, in the Edible category, Inferno was not present in the top 30 rankings until March 2025, when it entered at rank 50. This indicates a potential area of growth for the brand, as it begins to establish its presence in the Edible market.
In other categories, Inferno's performance in the Flower segment has been somewhat volatile, with rankings fluctuating between 62 and 93, though it managed to close March 2025 at rank 70. This inconsistency might suggest challenges in maintaining a steady market position. On the other hand, the Pre-Roll category has seen a steady improvement, with Inferno maintaining its rank at 44 from February to March 2025, after a significant leap from 87 in December 2024. Meanwhile, in the Vapor Pens category, Inferno's rank improved to 70 in March 2025, recovering from a dip in February. These movements indicate that while Inferno is gaining traction in certain categories, there are opportunities to further solidify its market position across others.
Competitive Landscape
In the Massachusetts Pre-Roll category, Inferno has demonstrated a notable upward trajectory in its market position from December 2024 to March 2025. Starting from a rank of 87 in December, Inferno climbed to 44 by February and maintained this position in March, indicating a significant improvement in its competitive standing. This upward movement is particularly impressive when compared to brands like Cloud Cover (C3), which saw a decline from rank 24 in December to 40 in March, and INSA, which did not make it into the top 20 during this period. Meanwhile, Root & Bloom showed a slight improvement, moving from rank 43 in December to 41 in March, but still lagged behind Inferno's rapid ascent. Additionally, South Shore Plug improved from rank 82 in December to 47 in March, yet Inferno's consistent sales growth and rank stability in February and March highlight its strong market performance and potential for continued success in the Massachusetts Pre-Roll sector.

Notable Products
In March 2025, the top-performing product from Inferno was Elvis Pre-Roll 1g, maintaining its leading position from January and February, with sales reaching 5229 units. Wedding Pie Pre-Roll 1g held steady in the second position for the third consecutive month, showcasing consistent demand. Superboof Pre-Roll 1g demonstrated a notable rise, climbing to third place from fifth in February, indicating increasing popularity. Ice Cream Candy Pre-Roll 1g re-entered the rankings at fourth place, while Sour Diesel Pre-Roll 2-Pack 1g made its first appearance in the rankings at fifth place. This month saw a reshuffling in the lower ranks, highlighting dynamic changes in consumer preferences.
Top Selling Cannabis Brands
Data for this report comes from real-time sales reporting by participating cannabis retailers via their point-of-sale systems, which are linked up with Headset’s business intelligence software. Headset’s data is very reliable, as it comes digitally direct from our partner retailers. However, the potential does exist for misreporting in the instance of duplicates, incorrectly classified products, inaccurate entry of products into point-of-sale systems, or even simple human error at the point of purchase. Thus, there is a slight margin of error to consider. Brands listed on this page are ranked in the top twenty within the market and product category by total retail sales volume.

