Mar-2025
Sales
Trend
6-Month
Product Count
SKUs
Overview
Market Insights Snapshot
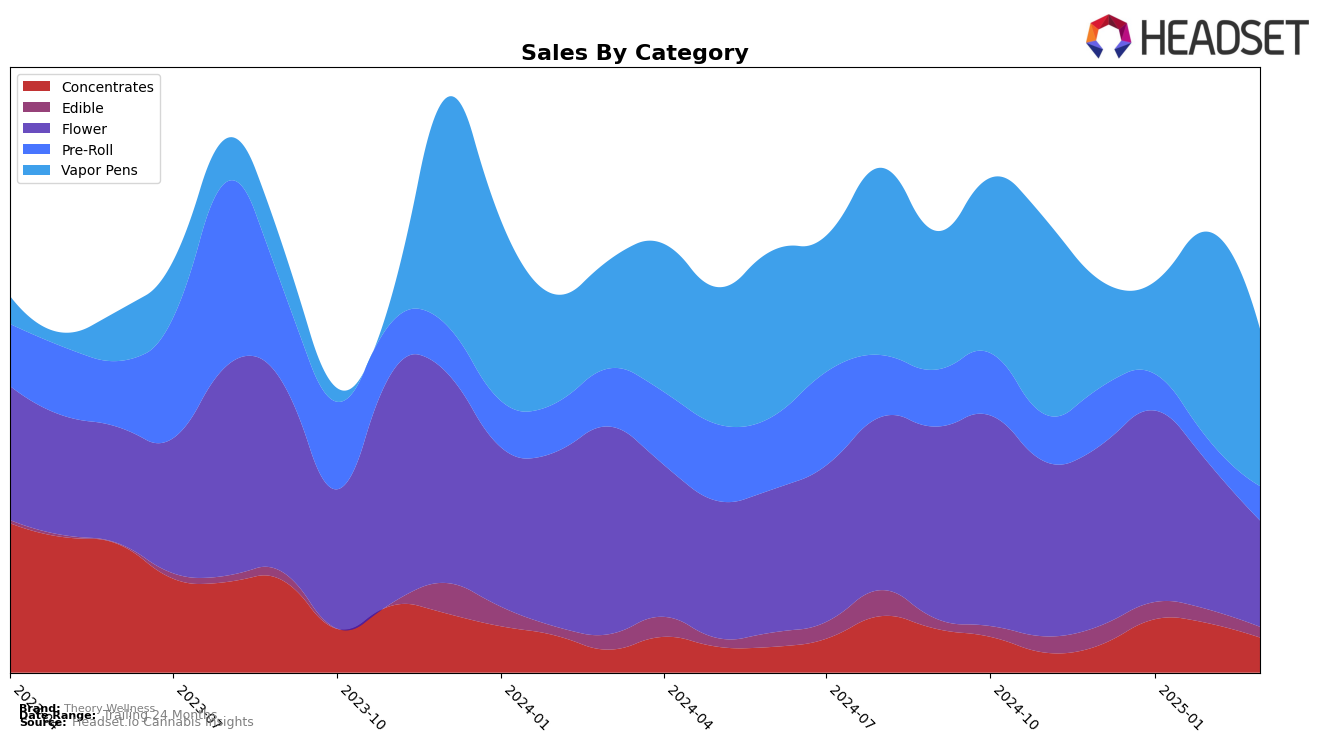
In examining the performance of Theory Wellness across various categories in Massachusetts, it is evident that there are notable fluctuations in their market standings. The brand has shown a positive trajectory in the Concentrates category, climbing from rank 29 in December 2024 to 17 by February 2025, before settling at 24 in March. This suggests a competitive edge in this category, despite a slight dip in the latest month. In contrast, the Edible category has seen Theory Wellness consistently hover outside the top 50, with a rank of 59 in March 2025, indicating challenges in gaining a foothold. The Flower category also reflects a downward trend, falling from rank 52 in January to 75 by March. The Pre-Roll category presents a mixed picture, with Theory Wellness dropping out of the top 30 entirely in February, only to reappear at rank 97 in March, signaling potential volatility or market challenges in this segment.
Shifting focus to New York, Theory Wellness made a notable entry into the Vapor Pens category in February 2025, debuting at rank 36, before experiencing a decline to rank 46 in March. This initial strong performance suggests the brand's potential to capture market share in this emerging market, although the subsequent drop highlights the competitive nature of the category. Interestingly, the Vapor Pens category in Massachusetts tells a different story, with Theory Wellness maintaining a relatively stable performance, fluctuating between ranks 49 and 59 over the months. This stability contrasts with the dynamic shifts seen in other categories and states, indicating a potential area of strength for Theory Wellness. Overall, these insights into different state markets and product categories provide a glimpse into the brand's strategic positioning and market challenges.
Competitive Landscape
In the Massachusetts flower category, Theory Wellness has experienced notable fluctuations in its market position from December 2024 to March 2025. Starting at rank 55 in December 2024, Theory Wellness saw a slight improvement to rank 52 in January 2025, before slipping to rank 60 in February and further to rank 75 in March. This downward trend in rank is mirrored by a decrease in sales over the same period. In contrast, Island showed a significant rise in rank from 56 in December to 34 in February, although it dropped to 74 in March, indicating a volatile but generally upward trajectory in sales. Meanwhile, LivWell re-entered the top 100 in February at rank 71 but fell to 82 in March, suggesting a struggle to maintain a stable position. Matter. also showed inconsistency, with ranks missing for February but recovering to 72 in March. These dynamics suggest that while Theory Wellness faces challenges in maintaining its rank, competitors like Island are experiencing more pronounced shifts, which could impact Theory Wellness's strategy in the Massachusetts flower market.

Notable Products
In March 2025, the top-performing product for Theory Wellness was the Golden Ticket Distillate Cartridge (1g) in the Vapor Pens category, maintaining its first-place ranking from February with impressive sales of 6,183 units. The Apple Fritter Distillate Cartridge (1g), also in the Vapor Pens category, climbed to second place from third in February, though it experienced a notable decrease in sales. Dosidos (3.5g) in the Flower category rose to third place, marking its first appearance in the rankings for 2025. The Butterwolf Pre-Roll (1g) debuted in fourth place, while the Winter Mint Distillate Cartridge (1g) entered the rankings at fifth. These shifts highlight a strong performance in the Vapor Pens category, with new entries in Pre-Roll and Flower categories showing potential growth.
```Top Selling Cannabis Brands
Data for this report comes from real-time sales reporting by participating cannabis retailers via their point-of-sale systems, which are linked up with Headset’s business intelligence software. Headset’s data is very reliable, as it comes digitally direct from our partner retailers. However, the potential does exist for misreporting in the instance of duplicates, incorrectly classified products, inaccurate entry of products into point-of-sale systems, or even simple human error at the point of purchase. Thus, there is a slight margin of error to consider. Brands listed on this page are ranked in the top twenty within the market and product category by total retail sales volume.

