Jun-2026
Sales
Trend
6-Month
Product Count
SKUs
Avg Price
YoY Sales Change
YoY Price Change
Market Insights Snapshot
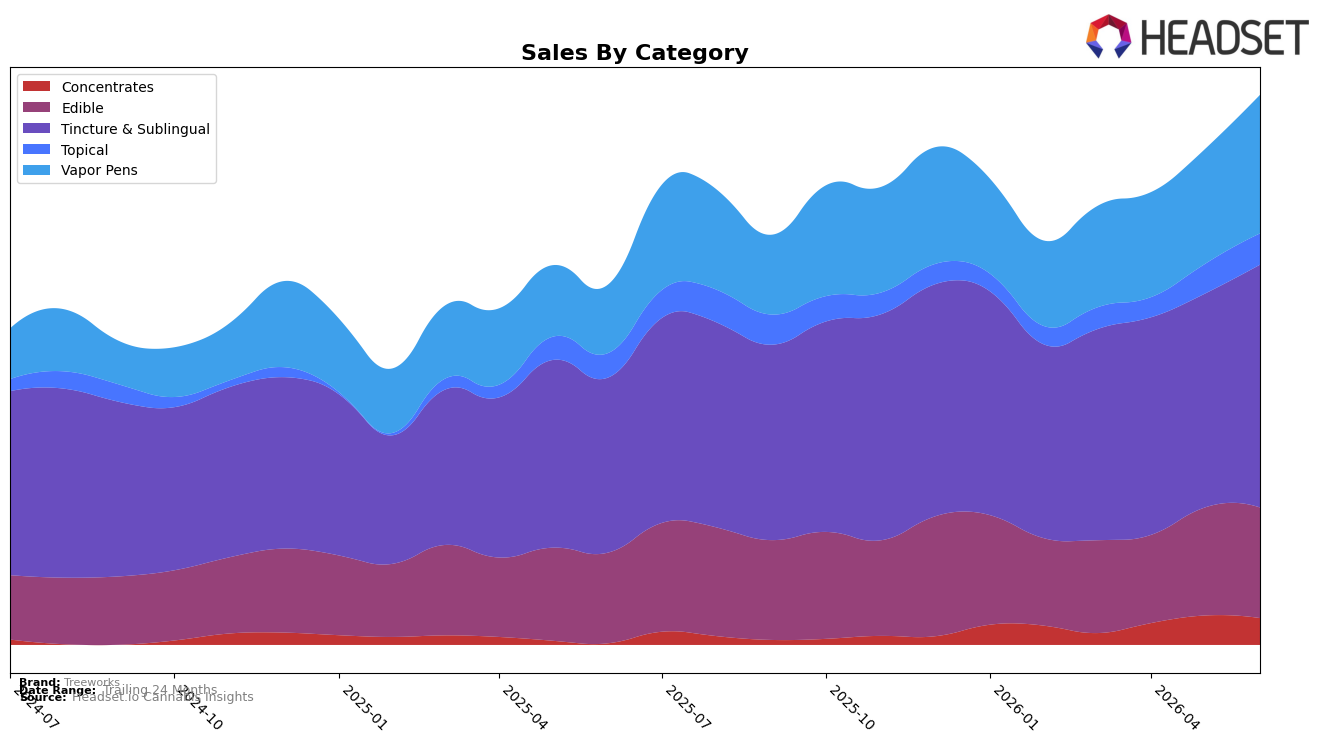
In June 2026, Treeworks concentrated 41.34% of sales in Tincture & Sublingual, with year-over-year growth of 35.76% and month-over-month growth of 12.72%, while Vapor Pens rose to 24.58% share on 84.23% YoY and 18.37% MoM. Edible held 20.09% share with 18.88% YoY and 2.15% MoM, while Topical accounted for 7.35% on 17.47% YoY and 3.80% MoM; Concentrates remained 6.64% share despite 156.57% YoY and a -5.85% MoM decline. With total brand sales up 43.81% YoY and average price up 2.35%, the mix skews toward higher-ticket formats (Tincture & Sublingual avg price $52.16; Vapor Pens $41.87) that expanded faster MoM than Edible, implying near-term momentum is being set by inhalable and tincture growth rather than digestibles.
This mix shift positions Treeworks to defend and extend leadership where it already ranks 1 in Tincture & Sublingual in New Jersey, as a 12.72% MoM gain in that category outpaced Edible’s 2.15% MoM and Topical’s 3.80% MoM, while the 18.37% MoM in Vapor Pens adds a second growth engine. The negative -5.85% MoM in Concentrates, despite 156.57% YoY, indicates volatility that could dilute efficiency versus channels where Treeworks already captures 41.34% share and outpaces the portfolio’s 43.81% YoY baseline; the pattern implies prioritizing Tincture & Sublingual and Vapor Pens will likely yield higher rank stability and share accretion than pushing deeper into Concentrates.
Competitive Landscape
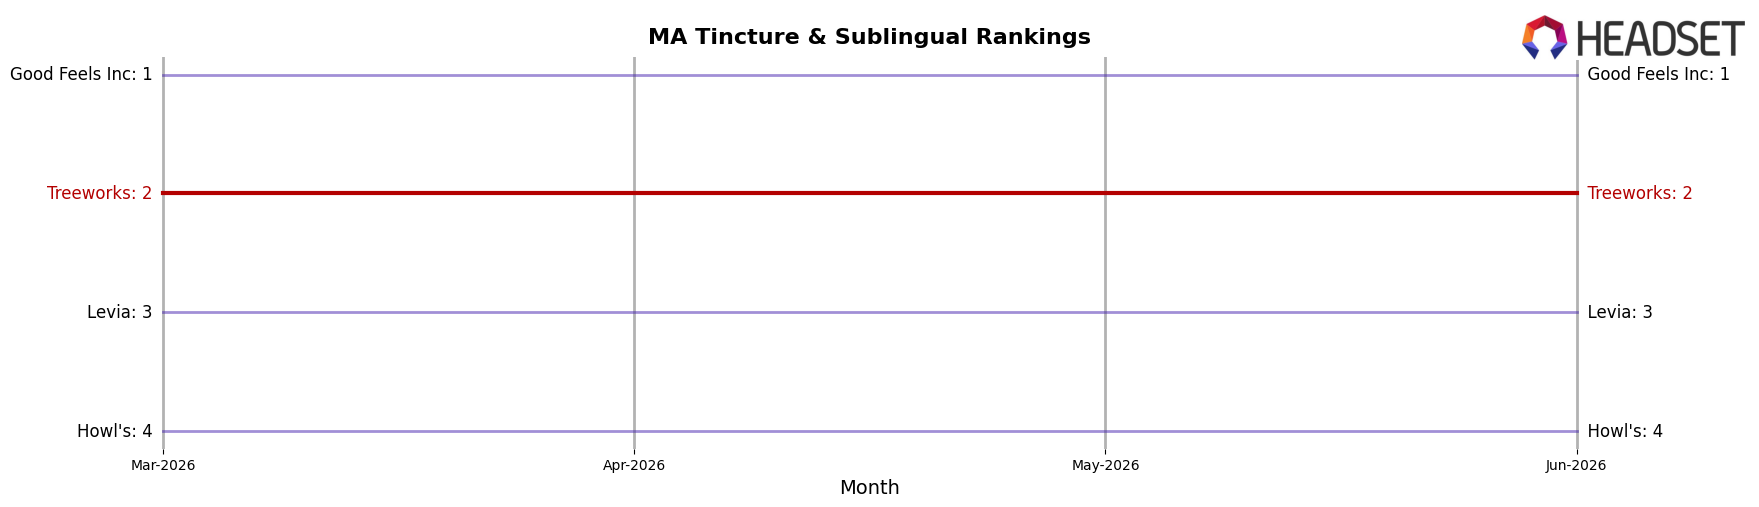
Treeworks sits at rank #2 in Massachusetts Tincture & Sublingual for June 2026, unchanged from #2 year over year, and stable versus March 2026 at #2, while its historical peak was #1 in June 2024; meanwhile, Good Feels Inc holds #1 with a -7.8% year-over-year sales change, and Levia is at #3 with +126.7% year-over-year sales growth, indicating upward pressure from below. Compared with Howl's at #4 and +22.6% year-over-year sales growth, and Squier's Elixirs rising to #5 from #10 year over year (+166.7% sales), Treeworks’ flat rank trajectory at #2 alongside a prior peak of #1 implies retention rather than expansion, suggesting that without a share-accretive move the next rank change is likelier to be downward than upward.
Notable Products
With no SKU posting a month-over-month move above +50% or below -10% in June 2026, the standout was the steadier climb of CBD/THC 1:1 Extra Strength Canna Cream (500mg CBD, 500mg THC, 2oz), up 20.4% and holding rank 2, while Dream Drops - THC/CBN 1:1 Indica Bedtime Bliss Tincture (300mg THC, 300mg CBN, 60ml, 2oz) dipped 3.0% at rank 6. The top seller, Happy - CBD/CBG/THC 3:3:1 Tropical Passionfruit Hibiscus Hash Rosin Gummies 20-Pack (300mg CBD, 300mg CBG, 100mg THC), gained 8.5% and remained rank 1, whereas Hummies - Sleep Wildberry Berry Gummies 20-Pack (100mg) slid 6.2% while staying in the top 10 at rank 10. Four of the top ten are Edible SKUs, but both Topicals sit within the top five and together generated $72,691, indicating Treeworks is leaning into functional formats where pain and recovery use-cases are converting more reliably than discretionary flavor-led gummies.
Top Selling Cannabis Brands
Data for this report comes from real-time sales reporting by participating cannabis retailers via their point-of-sale systems, which are linked up with Headset’s business intelligence software. Headset’s data is very reliable, as it comes digitally direct from our partner retailers. However, the potential does exist for misreporting in the instance of duplicates, incorrectly classified products, inaccurate entry of products into point-of-sale systems, or even simple human error at the point of purchase. Thus, there is a slight margin of error to consider. Brands listed on this page are ranked in the top twenty within the market and product category by total retail sales volume.

