Mar-2025
Sales
Trend
6-Month
Product Count
SKUs
Overview
Market Insights Snapshot
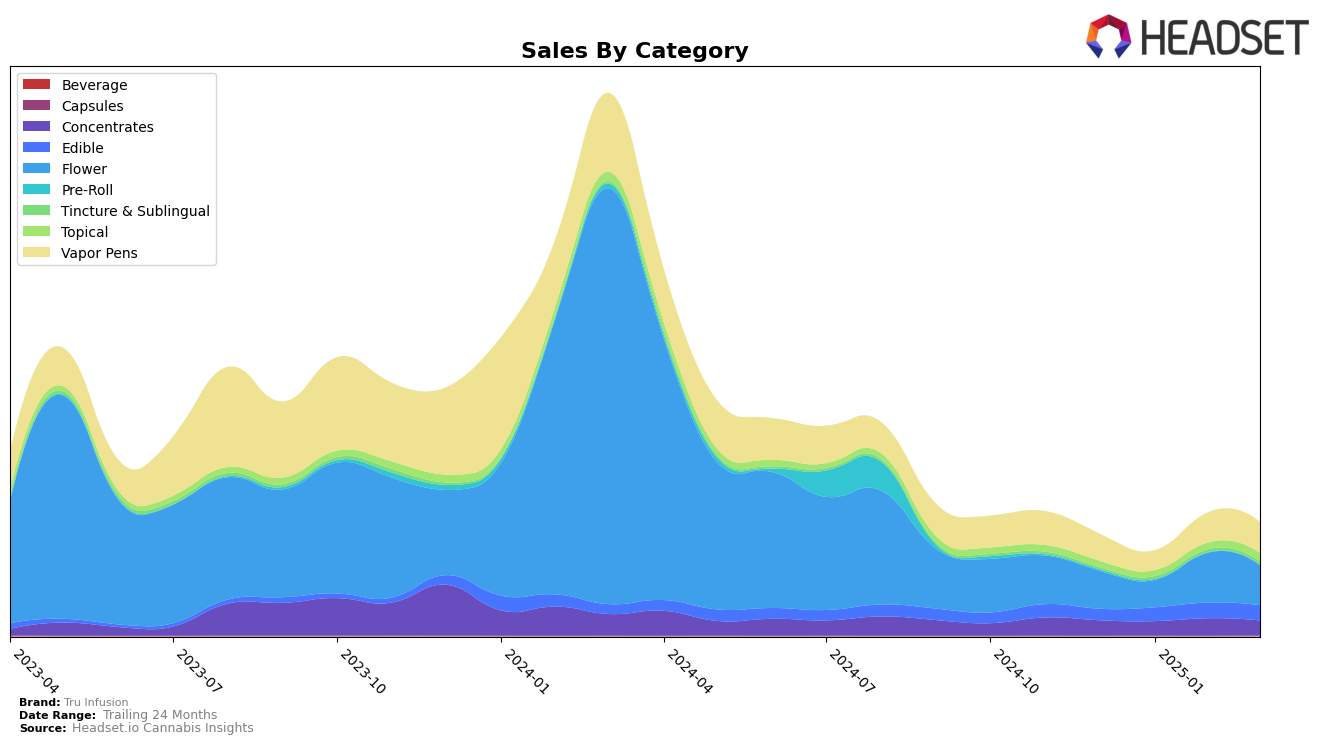
Tru Infusion has demonstrated varied performance across different product categories within Arizona. In the Concentrates category, the brand saw a modest fluctuation in rankings, starting at 13th place in December 2024, dropping to 15th in January 2025, then climbing to 11th in February before settling at 14th in March. This indicates a competitive and dynamic market environment where Tru Infusion is maintaining a solid presence. In the Edible category, the brand consistently hovered around the 20th position, suggesting a stable but not leading performance in this segment. A notable highlight is their strong presence in Tincture & Sublinguals, where they consistently held the 3rd position from January to March 2025, indicating a robust foothold in this niche market.
Tru Infusion's performance in the Flower category in Arizona showed significant variability, with rankings dropping out of the top 30 in January 2025 before rebounding to 23rd in February and 26th in March. This suggests potential challenges in maintaining a consistent market share in this highly competitive category. In contrast, their Topical products have seen a positive trajectory, moving from 4th place in December 2024 to securing 2nd place by February and March 2025. The Vapor Pens category showed a similar pattern of maintaining a middle-tier position, with rankings fluctuating slightly but consistently staying within the top 30. These insights highlight the brand's strengths and areas for potential growth within the state.
Competitive Landscape
In the competitive landscape of the flower category in Arizona, Tru Infusion has demonstrated notable fluctuations in its market position over the past few months. Starting from December 2024, Tru Infusion was ranked 27th, but experienced a dip in January 2025, falling out of the top 30, before rebounding to 23rd in February and slightly dropping to 26th in March. This volatility contrasts with competitors like Elevate Cannabis Co, which maintained a relatively stable position, hovering around the 30th rank. Meanwhile, 22Red showed a downward trend from 19th to 24th, and TRIP experienced a more significant drop from 15th to 25th. Despite the competitive pressure, Tru Infusion's sales saw a significant recovery in February, surpassing its December figures, which suggests potential for growth if the brand can maintain its upward momentum. This analysis highlights the dynamic nature of the Arizona flower market and underscores the importance for Tru Infusion to leverage strategic marketing efforts to enhance its market share and stabilize its rank.

Notable Products
In March 2025, Tru Infusion's top-performing product was the Sativa Strawberry Kiwi Gummies 10-Pack (100mg) in the Edible category, maintaining its position as rank 1 from previous months with sales of 2719 units. The Peach Gas (3.5g) in the Flower category made a notable entry at rank 2. The Indica Brownie 10-Pack (100mg) improved its rank significantly, climbing from rank 5 in February to rank 3 in March. Indica Blueberry Gummies 10-Pack (100mg) held steady at rank 4, showing consistent performance. Meanwhile, Indica Watermelon Rosin Gummies 10-Pack (100mg) fell from rank 2 in February to rank 5 in March, indicating a shift in consumer preference.
Top Selling Cannabis Brands
Data for this report comes from real-time sales reporting by participating cannabis retailers via their point-of-sale systems, which are linked up with Headset’s business intelligence software. Headset’s data is very reliable, as it comes digitally direct from our partner retailers. However, the potential does exist for misreporting in the instance of duplicates, incorrectly classified products, inaccurate entry of products into point-of-sale systems, or even simple human error at the point of purchase. Thus, there is a slight margin of error to consider. Brands listed on this page are ranked in the top twenty within the market and product category by total retail sales volume.

